
The Lead Crisis in Chicago
- 16 minsWith the Flint, Michigan crisis, the world has become more wary of the dangers of ingesting lead, commonly found in paint and tap water. Impairment in child development, damage to the cardiovascular system, decreased central functions: list goes on and on. Lead in drinking water comes from absorption from lead pipes, called Lead Service Lines (LSLs). In 1986, the creation of all new LSLs were banned by the Environmental Protection Agency (EPA), and cities were directed to replace them with safer pipes made of copper.
Chicago had an estimated 400,000 LSLs supplying water to its citizens, and has until 2077 to replace all of them. The question is: why have they only replaced 280 lines, as of December 2022? Moreover, why are so few Chicagoans aware of this problem? How is this affecting our city?
In Spring 2023, I led a team of IIT students to investigate this issue. This was through MATH 497: Special Problems in Business, Government, and Industry, run by Professor Robert B. Ellis of the Applied Mathematics department. The class was credited as an "Interprofessional Project" (IPRO) course, which are designed for students of different majors to solve problems related to technology, health, community, and innovation.
The Peanut Butter Hunters (PBH) spent the semester exploring data released by Chicago on lead levels in drinking water. With statistical analysis, data science techniques, and geo-spatial visualization, we concluded there was, indeed, a lead crisis in the city.
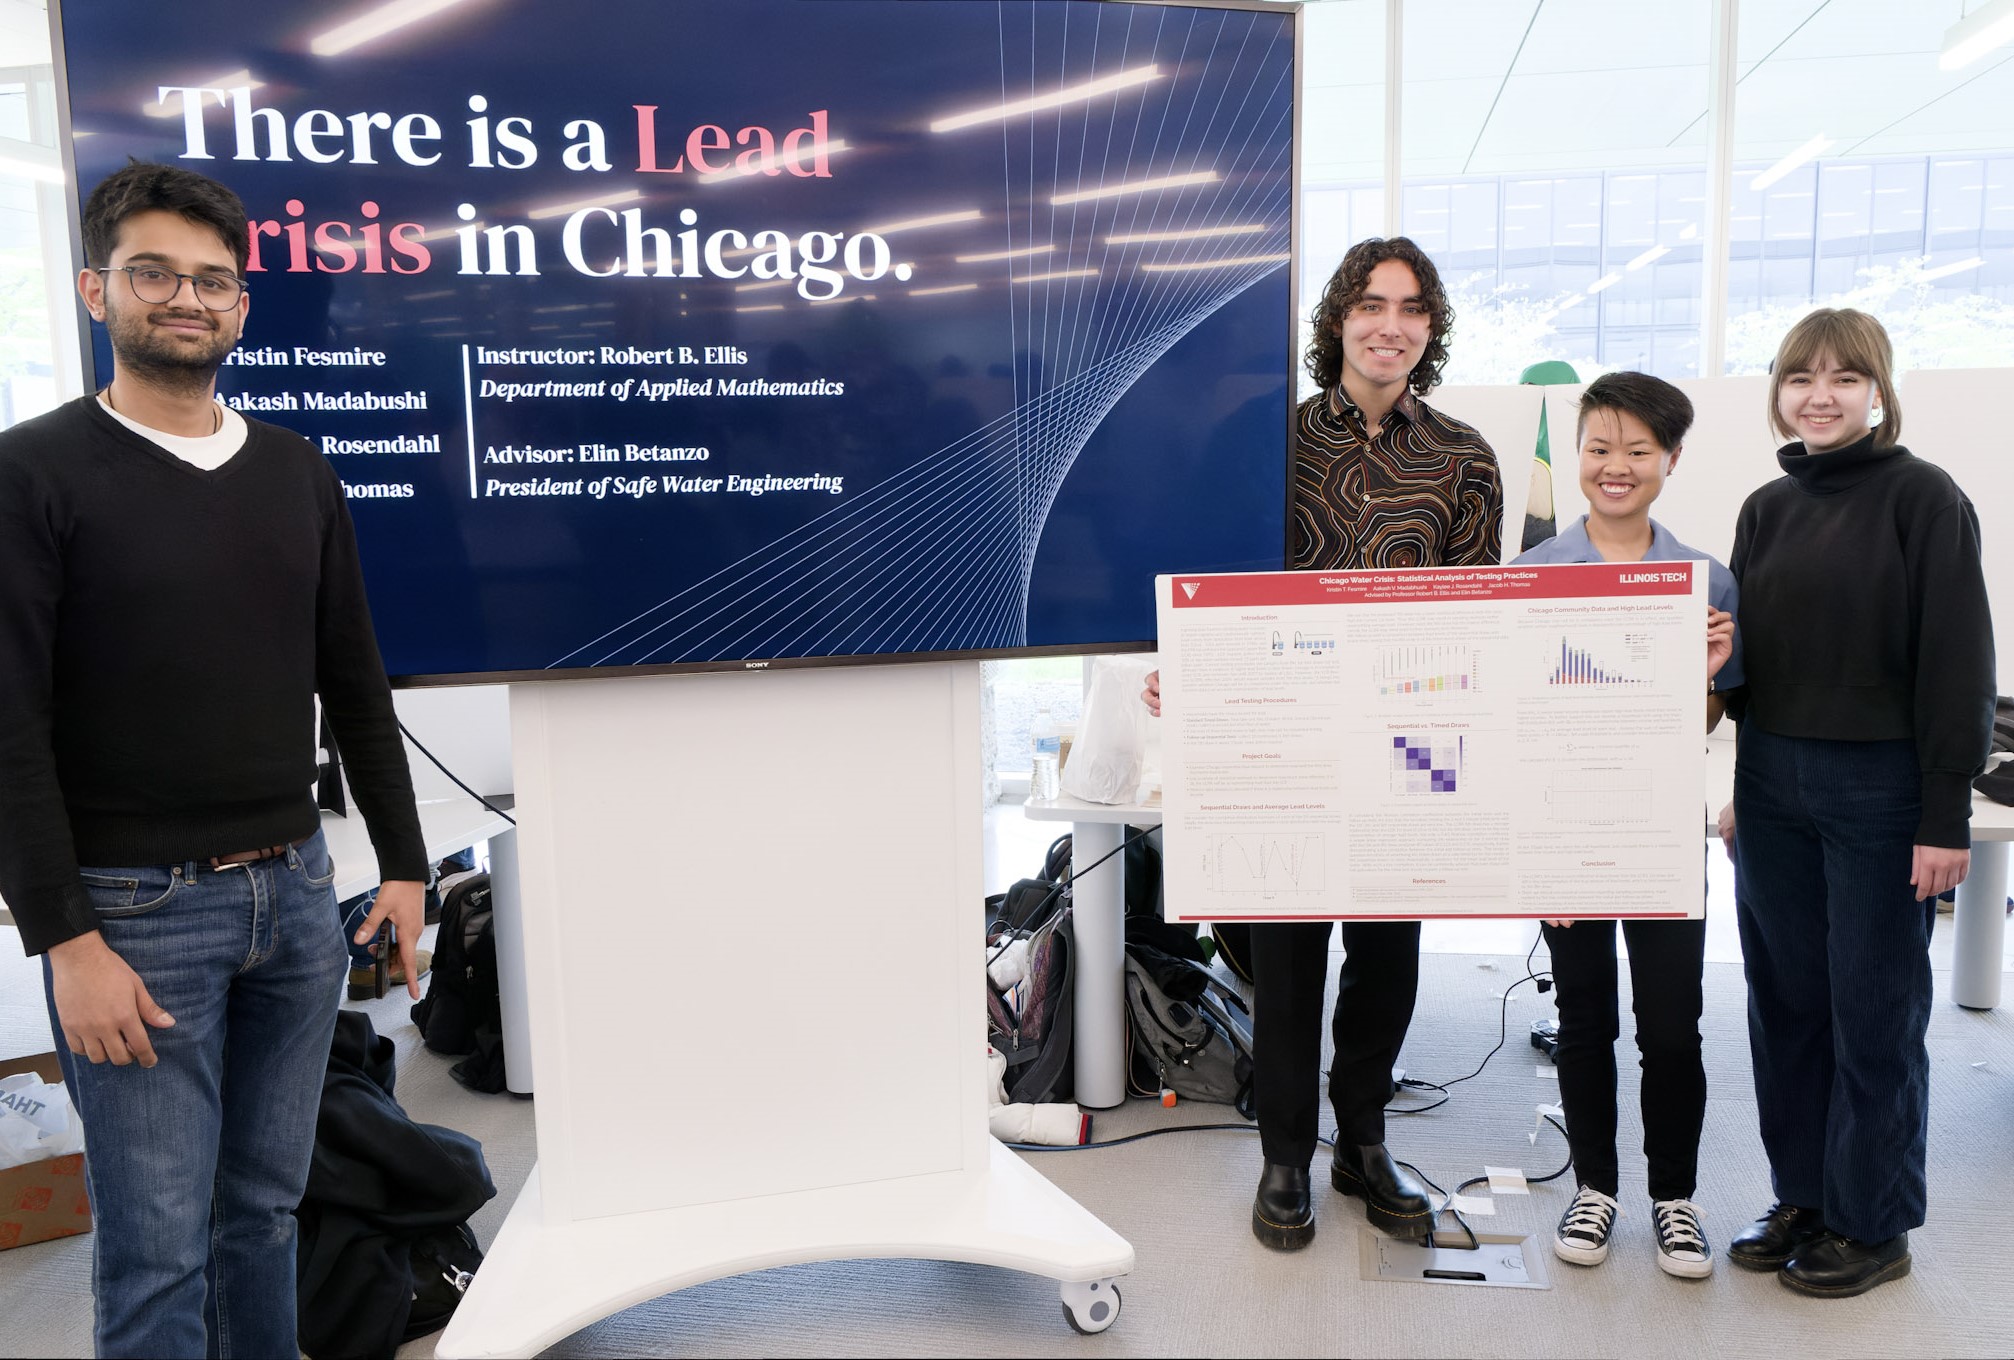
Here is our research, which won us the runner-up title in the Health and Community Tract at IPRO day. We were also advised by Elin Betanzo, a water engineer who founded Safe Water Engineering and worked on the Flint crisis. I am forever grateful for the guidance of Professor Ellis and Ms. Betanzo; without them, we wouldn't have discovered such devastating results.
The History
As stated earlier, LSLs weren't banned until 1986; any residences built before then likely have LSLs servicing their water. In 1991, the EPA set a federal regulation called the Lead and Copper Rule (LCR): no more than 10% of water samples could exceed 15 parts per billion (ppb) of lead, the Lead Action Level (LAL). Otherwise, the EPA and the city must take action.
In 2022, Chicago reported a 90th percentile of 6.8ppb; technically, they are in compliance with the LCR. We find several issues with this yearly procedure:
- Chicago is only required to test 50 households, a mere .0045% of total residences. Under the LCR, up to five households could have had more than 15ppb.
- There's evidence the city only tests households of employees who work for the Chicago Department of Water Management (CDWM).
- Current procedures use samples from the 1st liter drawn from your tap. This may not be the most representative of your average lead level, since it takes time for water to travel from the street main pipe (possibly an LSL) into your residence.
Although the first two factors are unlikely to change anytime soon, the issue of using 1st liter draws may soon be mitigated. In October 2024, the EPA will start enforcing the Lead and Copper Rule Revision (LCRR): rather than taking the 1st liter as the sample, they will take the 5th liter sample. We would expect that the later draw indicates lead levels more accurately. It's unknown whether Chicago will still be in compliance under the LCRR.
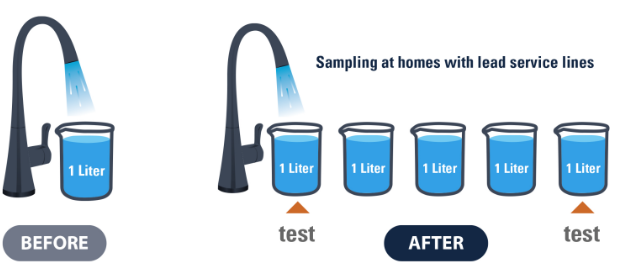
The PBH were interested in ALL lead results reported by the city within the last few years - not just these 50 households. Although uncommon knowledge, any Chicago resident is eligible to test their lead for free, a service provided by CDWM. They may request a lead testing kit or schedule an appointment for a CDWM employee to test it for them. The initial testing kit instructs 1st liter draws, but some households may perform follow-up sequential testing, in which 10 1-liter draws are taken in a row.
Our research focused on the results from sequential testing. We examined how well the 1st draw represents a household's lead levels, or the current method. Using the 1st and 5th draws of the sequential results, we also compared the effectiveness of the LCRR's procedure in representing lead over the LCR. Finally, we investigated the relationship between low income and high lead levels.
The data we used in this research is public information, released by the CDWM. Data on all Chicago households, such as price, income, and location, was retrieved from the Cook County Assessor's Office.
The Results
The LCRR arose from questions on how best to sample water for lead testing: is the 1st or 5th draw more indicative? Or is it another liter draw? We sought to answer this by comparing each liter draw. For each household's report, we calculated the average lead level across the 10 draws. In theory, the draw best representing lead would follow a similar distribution as the average lead level; we drew the cummulative distribution function (CDF) for each of the 10 draws and compared the difference between distributions:
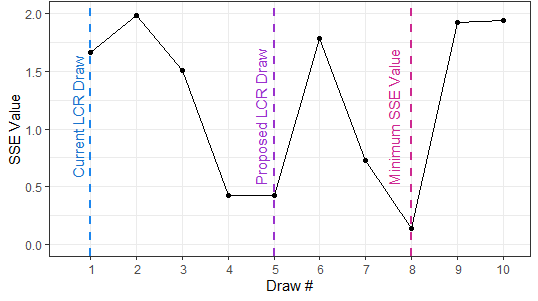
Here, we marked the SSE of the 1st liter (LCR) and 5th liter (LCRR). We saw that the 5th draw has a smaller error; even so, the smallest error for all draws belonged to the 8th draw. Looking at the CDFs, we clearly saw the 1st draw CDF varies from the average lead moreso than the 5th or 8th draw.
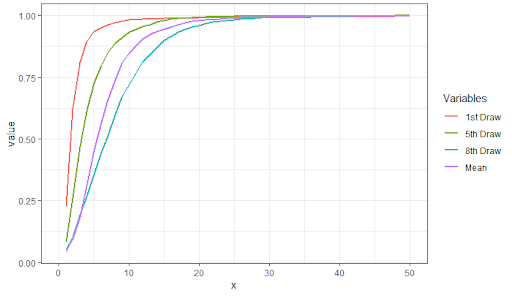
Upon a simple examination of the spread of lead levels for each draw and the average, we also saw the 8th draw is of the worst three draws of the sequential data.
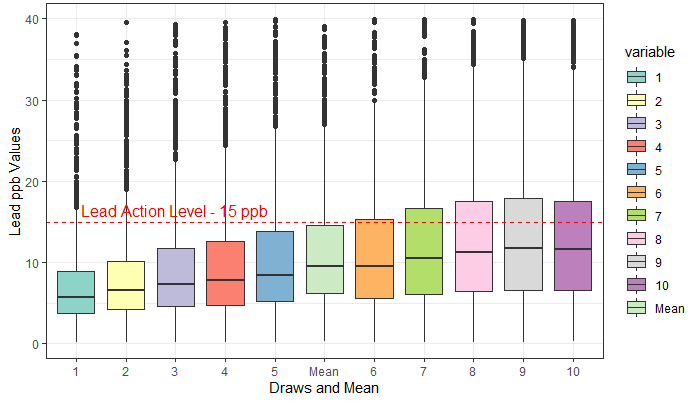
From this work, we concluded the LCRR proposes a better sampling method; i.e., one that represents the average lead case better than the current LCR. Since we found the 8th draw to have a closer distribution to the average case, will the LCRR require further revisions? In the above graph, we also saw a general trend: the more liters collected, the higher the quantiles of lead. Perhaps collecting even later draws would give a better estimate.
This might need to be investigated further; this could be a problem unique to Chicago. Regardless, for the city, the LCRR will be an improvement upon current lead testing procedure.
In the testing kits supplied by the CDWM, the first liter is collected from the tap. After this, additional liters are collected at the 2-3 and 5 minute mark. We compare this initial "timed draw" method with the follow up sequential draw method: do they have a relationship?
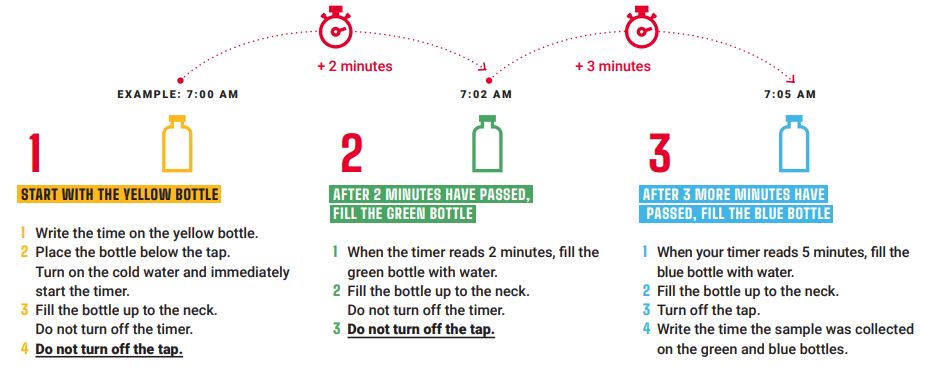
We calculated Pearson correlation coefficients between initial and follow-up results; values close to 1 between, say, the 3 minute results and the 5th draw may indicate validity in the initial testing methods.
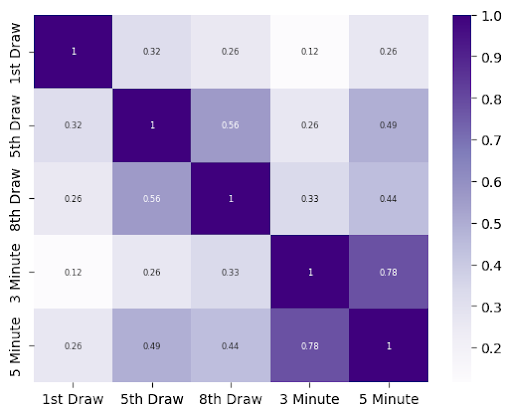
The coefficients between draws demonstrate low correlations. In comparing the 5 minute draw to the sequential draws, we saw it had a higher correlation with the 5th draw than the 1st, but at a value of .49, the relationship wasn't strong.
We also considered the R² values of simple linear regression between the draws. The 5 minute draw had an R² value of .213 with the 5th draw, and .170 with the 8th draw. This indicated the initial tests do not accurately predict results from the follow-up tests.
Whilst Chicago claims to have "reasonable" lead levels (although no amount of lead is safe for the body), the introduction of the LCRR may change public awareness on the lead crisis. In the meantime, since current testing methods don't accurately reflect lead levels, we suspected some residences may be disproportionately affected: perhaps those of lower incomes, access to education, price, etc.
We classify each result as having low (less than 5ppb), medium (5ppb to less than 15ppb), and high (15ppb+) lead. We first considered the location of residence:
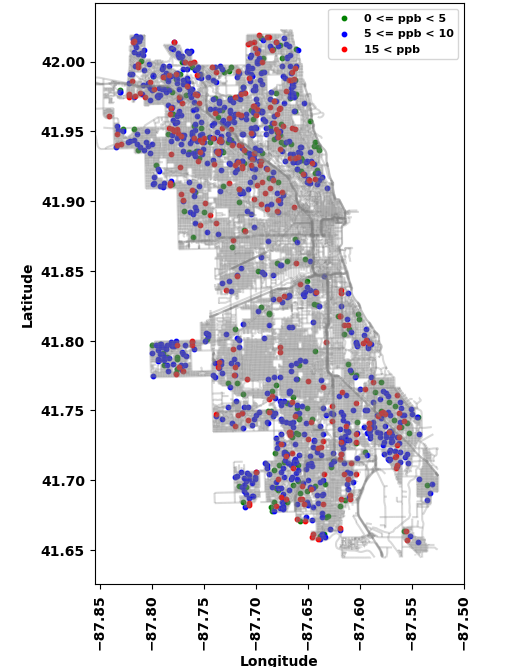
Author's note: this map was not included in our final presentation, but was the catalyst for the rest of our work in community data. Additionally, I'm addicted to coloring graphs.
With no discernable pattern, we then considered other factors. One which we had the most data was median income for each census tract:
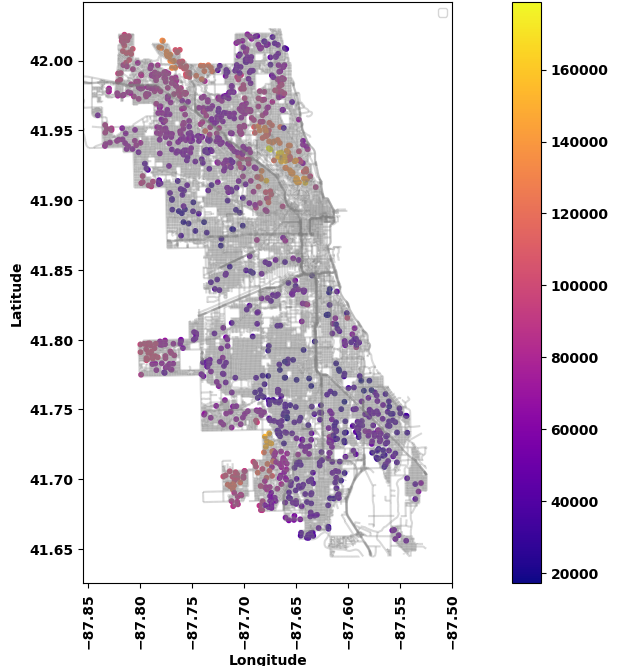
We noted many sequential tests came from residences north or south of the Loop, and tend to have lower incomes. We followed up the distribution of lead intervals by income:
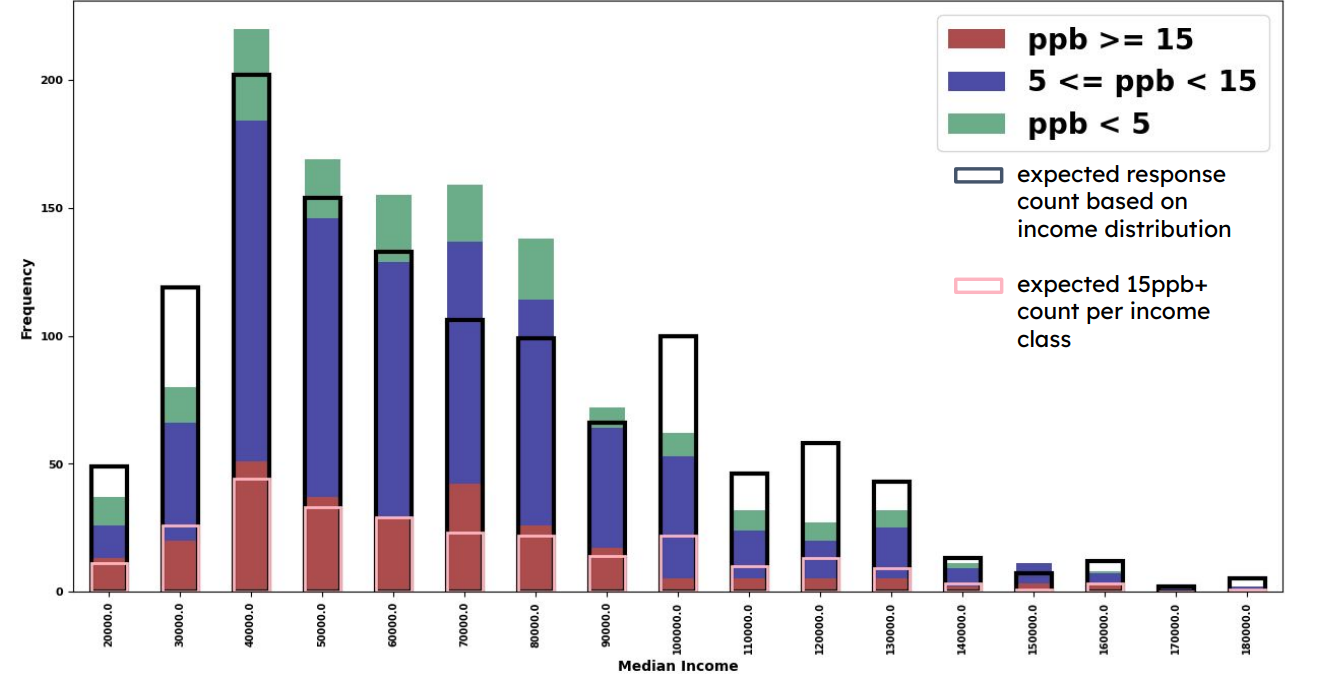
Those at low-mid income classes completed less follow-up sequential tests than what we would expect, based on the overall distribution of all income in Chicago (shown in black). Likewise, we saw a similar pattern with the total amount of cases at "high" lead levels. These classes reported higher counts of higher lead than those at the low or high income classes, based on income distribution (shown in pink).
It seems lower-income residences reported higher lead levels than those at higher incomes. To further support this, we developed a statistical hypothesis test using the Irwin-Hall distribution (IH).
H0 = There is no relationship between income and lead levels.
HA = There is a relationship between income and lead levels.
α = .05
We let x1, x2,..., xm be the average lead level for m test results from the sequential data. We assumed the income quantile of each household is i.i.d. from the uniform distribution. Thus, the sum of quantiles of these points = X ~ IH(m).
Set some ppb threshold, k. We calculate x to be the sum of the income quantiles for all points which are at, or exceed, k.
With x, we calculate Pr(X ≤ x) under the distribution for different values of k. In other words, we find the probability that the sum of quantiles is less than x, assuming an IH distribution.
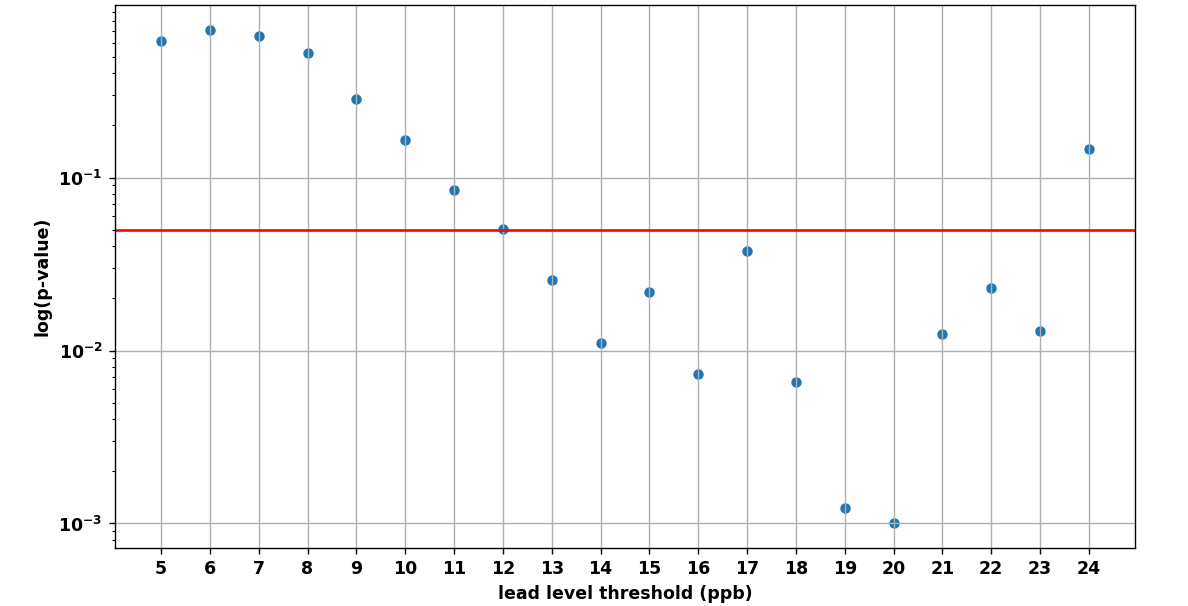
For several lead thresholds, such as 15ppb, we saw significance. Incomes for households reporting more than 15ppb were low enough to reject our null hypothesis; we concluded there is a relationship between low income and high lead levels.
Discussion
The PBH found significant results: namely, the LCRR 5th draw will likely be a better indicator of lead than the current LCR 1st draw, current testing procedure isn't representing current lead and doesn't predict follow-up testing well, and there is a relationship between high lead and lower income.
Yet, it's hard to determine the next steps for Chicago. Even with the LCRR, sampling such a small number of households (and having biased responses to begin with) still may not exceed the 90th percentile standard by the EPA.
A major concern is how little the public knows about lead testing and the LSLs in the city. Chicago offers free testing, and supposedly free water filters to those greatly affected, but so few citizens know about this. On presentation day, each judge, student, and faculty we talked to only had minor knowledge about the problem. Everyone remembers the Flint crisis, but not everyone knows what's in their own water.
Even for those interested, current sources of information are lacking, to say the least. To find reports sent to the EPA, the team had to access to the City of Chicago site, click through at least six webpages, and search for the lead results within the resulting document. Navigating the CDWM website is highly unintuitive; information about lead in water is hard to find, sections are out of date, and the main page is poorly organized.
Testing rates are low: only about 30,000 initial tests have been submitted since 2016; of those, 2,400 follow-up tests were submitted. With a city of more than one million residences, this is nearly nothing. And for those who manage to request lead testing kits from the CDWM, the process is long and arduous. In the middle of the semester, I moved from a high-rise apartment to a multi-unit house, on the south side of Chicago. I was fortunate to have knowledge about this problem, and requested a testing kit.
- April 10th: I signed up for a lead testing kit
- April 18th: Recieved kit
- April 25th: Employee from the CWDM picked up our sampled water
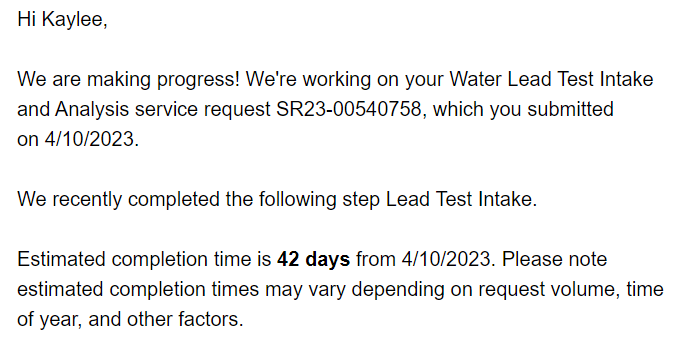
- May 1st: Recieved an email from the city (below)
- May 22nd: Recieved results via letter (below)

We found our results from the 1st liter draw exceeded 15ppb; in fact, it was nearly double the LAL.
This process took 43 days in total. Perhaps it's a consequence of slow-moving bureaucracy, but combined with the lack of easily accessible, understandable, and updated information?
Chicago is failing its citizens. It starts as moving slow to replace LSLs. Then, it's sampling less than 0.01% of biased households to send to the EPA, and claiming our water is safe for consumption. After that, it's failing to maintain current information on the lead problem. For those citizens who are aware, the process is time-consuming and unclear. For those who aren't? For those in lower-income neighborhoods (and maybe other factors)?
They bear the consequences of the lead crisis... and they don't even know it.
Thoughts, Questions, and Concerns
My team and I chose not to reach out to news outlets, public figures, or local politicians. I would say we had a good reason: we were students, and polishing this project took much of our effort at the semester's end.
However, I am still curious to see the city's response once LCRR is in effect. Education on the impacts of lead in water and LSLs, overhaul on lead testing, picking up the pace for LSL replacements: all lead to a healthier, more knowledgeable population. I can hope this revision will be the catalyst for change, but only time can tell.
For those interested:
Good luck, reader. And if you live in Chicago: test your water.
TL;DR:
- Chicago has hundreds of thousands lead pipes supplying water, but is currently in compliance with current EPA LCR regulation (though testing may be biased).
- The EPA is set to release a new revision, the LCRR, in 2024. We found that the LCRR's method of testing water is more indicative of lead levels than the LCR.
- Meanwhile, households at lower-incomes tend to have higher lead levels, and are being disproportionately affected.
- The lack of public discussion, awareness, and education on this crisis is critical; Chicago, moving forward, must make changes to secure the health of the public.
Update 8/15/24
I presented these results twice: once as part of IIT's Innovation Day in May 2023, and again for the Menger Day poster showcase for the Applied Math Department in April 2024. Around that time, the Guardian had just released a study on the excessive amounts of lead in the blood of Chicago children. Rest assured, I made sure to cite this article the second time around. Please give it a read.
